Timelines-Charts-Graphs
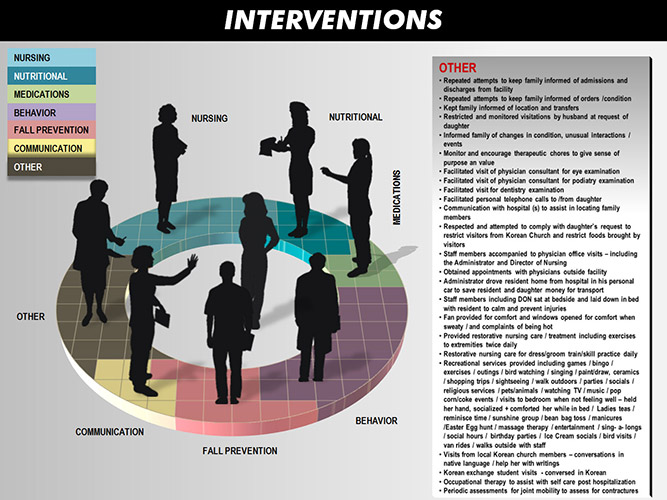
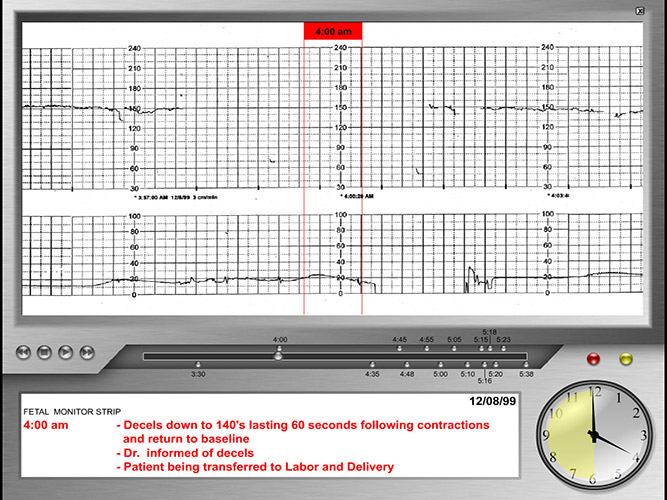
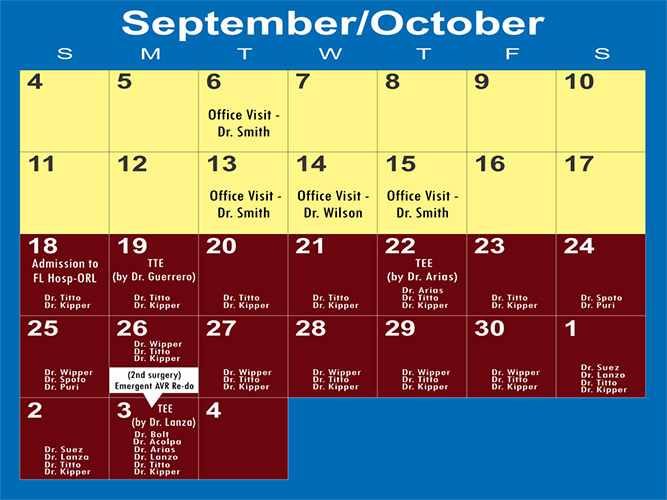
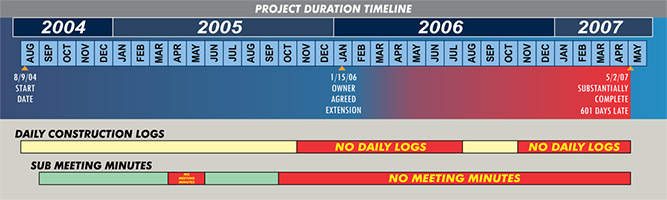
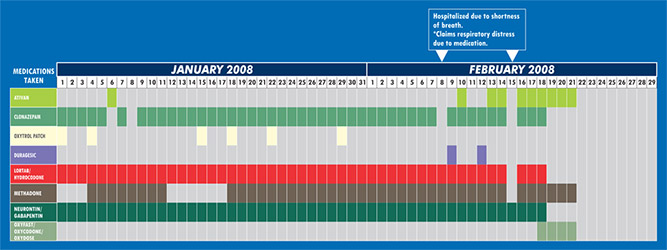
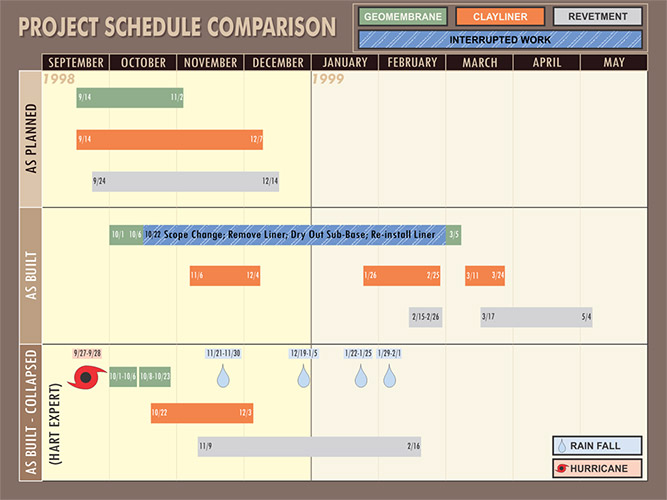
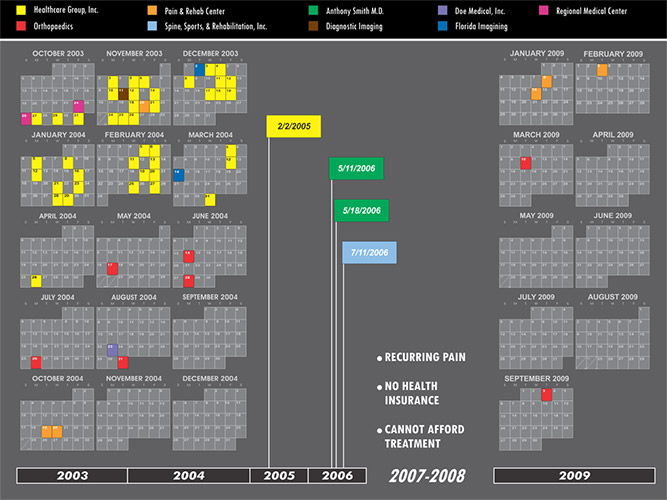
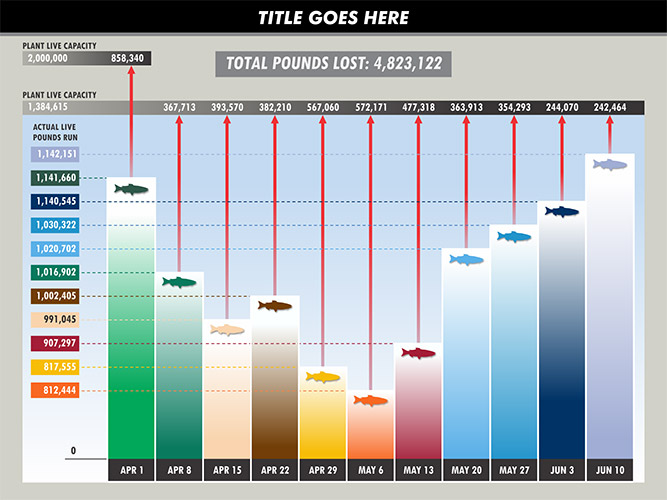
When the information needs to be followed, one of the best ways to easily sum up & highlight all of your points of interest is to utilize Timelines-Charts-Graphs. The viewer can quickly scan the overview as each event is being introduced. If multiple levels of information need to be cross referenced throughout a chronology, a timeline can be designed in such a way as to relegate pertinent data together in logic clusters to keep the message clear & keep it from looking too cluttered. Charts & Graphs can take compiled data & reports and bring them to life with easy-to-understand representations. Further, the use of legends can breakdown the divisions of facilities, entities & personnel so as to facilitate visual processing.
Below are some different samples that can give you some ideas as to layout and design. Lets get started today! 1-800-589-2688